Abstract
How much energy does a house actually consume? Within a 10 day period I was able to watch and see how my use of energy varied from day to day, and even hour to hour. I figured that the certain times of day when I was actually home that the energy would go up. But what I didn't realize was what household items consume the most energy. That turned out mostly to be the air conditioning and the dryer. Which we use everyday!
Problem
How energy do I consume within a 10 day period?
Materials
House with electricity, electricity meter, Smarthub app, access to internet.
Method
To analyse the electricity consumption:
Read the electric meter at the same time every day for a 10-day period and record the values.
Make daily notes on the patterns of electricity use in your household, particularly the use of large appliances.
Note the usual settings for the air conditioner and water heater, the amount of cooking done, the type of lights used, the amount of laundry done, and so forth.
Also, make notes on aspects of the weather that may affect heating or cooling. Weather notes should include cloud cover and high and low temperature readings for that day. Report local temperature readings and thermostat settings in degrees Celsius.
Data and Analysis Questions
Table 1: Meter Readings, Observations and Usage Notes for the period of Oct. 13 - Oct. 23
Date | Meter Reading (kWh) | Daily Usage (kWh) | Weather Observations | Notable Appliance Usage
Oct. 13 | 20,196 kWh | 18 kWh | Average temp. was 18 degrees Celsius. | watched football at noon
Oct 14. | 20, 214 kWh | 18 kWh | Average temp. was 17 degrees Celsius. | ran dryer around 10:30 pm
Oct 15. | 20, 232 kWh | 13 kWh | Average temp. was 17 degrees Celsius. | ran dryer around 11 pm
Oct 16. | 20, 245 kWh | 16 kWh | Average temp. was 18 degrees Celsius. | ran dryer around 10:30 pm
Oct 17. | 20, 261 kWh | 16 kWh | Average temp. was 19 degrees Celsius. | left dryer running from 9-midnight
Oct 18. | 20, 277 kWh | 15 kWh | Average temp. was 17 degrees Celsius. | turned on a lot of lights around 6 a.m
Oct 19. | 20, 292 kWh | 20 kWh | Average temp. was 17 degrees Celsius. | washed dishes around 10:30, did laundry at 3 pm
Oct 20. | 20, 312 kWh | 18 kWh | Average temp. was 17 degrees Celsius. | did laundry at 3 pm
Oct 21. | 20, 330 kWh | 17 kWh | Average temp. was 11 degrees Celsius. | ran dryer around 10:30 pm
Oct 22. | 20, 347 kWh | 16 kWh | Average temp. was 14 degrees Celsius. |
Oct. 23| 20, 363 kWh | 22 kWh | Average temp. was 14 degrees Celsius. | did two loads of laundry at 8 pm.
Average Daily Usage: 18.9 kWh
Calculating consumption
Average daily cost for electricity is $3.46. Cost per kWh is about $.18 per kWh.
Table 2: Cost of Electricity
Total Amount of Power Bill: $111.01
Days of Power Bill: 32
Average cost per day: $3.46
Average usage per day (from table 1): 18.9 kWh
Average cost per kWh: $.18.
843 kWh used per month, 50% = nuclear, 40% = coal, 10% = natural gas.
I release 400 kg/kWh of CO2 per month, and only about 2.5 kg/kWh of SO2.
Table 3: Carbon Dioxide and Sulfur Dioxide Emissions, by Source, for generating electricity
In the month of April this year, we almost doubled our electricity bill compared to Junes bill. We used up 1,480 kWh. Probably half of this is on air conditioning. We used less in the summer month of June, mostly because we were almost never home and because this summer we never reached above 90 degrees. We only spent $100 on electricity in June.
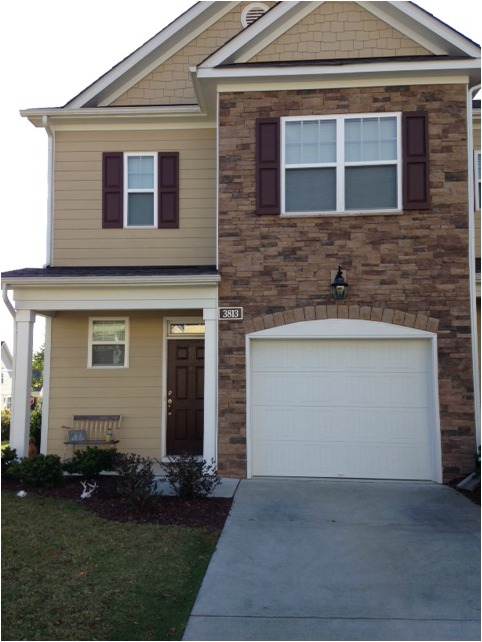
House Report:
The amount, location and quality (type and R-value) of insulation
Location is in the attic, the R-value of the insulation is 45. The type is loose-fill.
The amount of shade provided by trees or shrubs
No trees around my house at all.
The condition, composition, and color of the roof
Condition of the roof is new, color is black. Composition is shingles.
The air circulation in the attic
Very little air circulation in our attic.
The tightness of the fit for doors and windows
Tight doors and windows.
The color of outer walls (does it absorb or reflect heat?)
Outer walls of the house are cream, so they are able to reflect heat.
Discussion
Through this project, I learned that small changes can easily be made to help save electricity. Anything like using the energy preferred setting on the dryer to turning the lights off when you're not in a room anymore. All of these changes can lead to less emissions of CO2 and SO2 being released due to our homes energy consumption.
Conclusion
This lab really helped me learn about all of the energy that I use. Even thought we only looked at a 10 day period, it helped me gain lots of insight on how I can reduce my usage. I predicted that I would use more energy in the morning and at night time when I'm most active in my home, and I was correct. On my graphs that showed my usage, I used about 5 kWh more around 6-7 am and 9-12 pm. There could have also been errors in the experiment, just because the meter could have been read wrong that day. It's also true that during this season we typically don't use the heat or the air conditioning, which is why all of the kWh were relatively low. If we would have done this lab in December it would have doubled everyday due to the heat running. The article that I found relates to what we talked about in class, passive heating. I discovered that my bedroom is always facing towards the sun and that's why my bedroom is hotter. This bothers me, and that results in me turning my AC on which increases our energy bill!
