Abstract:
Using items found in a science classroom setting, we were able to create two sets of tools that were able to help measure the levels of ozone inside and outside, and measure the amount of particulate matter inside, and outside, and compare the air quality of the two settings. Placing one set inside the school in the library, and one outside on the back patio, I made a hypothesis that the air quality inside the school would be better. Although the ozone measuring tool that was placed inside got misplaced, it was still concluded that the hypothesis was true using all of the classroom's data, the air quality inside of Heritage High School, was better than that outside.
Problem:
How does the indoor air quality of Heritage High School, compare to the outdoor air quality?
Hypothesis:
If we measure air quality both indoor and outdoor, then the indoor air quality will be better.
Parts of the Experiment:
The independent variable in this experiment was the location where the air quality was tested. The dependent variable was the air quality measured. The control group was the Petri dish that we left covered, and the ozone measuring device that was covered as well. Both remained at zero. The controlled variables in the experiment were that the class had all the same types of filter paper, iodide and starch mixture, glass slides, q tips, and petroleum jelly
Materials:
Potassium Iodide, corn starch, beakers, spatulas, a large graduated cylinder, test tube rack, filter paper, microscope slides, petroleum jelly, q-tips, microscopes.
Method:
1. Half the class should work on preparing the ozone monitoring test strips by placing 100ml of water in a 250 ml beaker, and adding 5g of cornstarch. Then heat and stir the mixture until it gels (when the mixture becomes thick and clear). Remove the solution from heat, add 1 g of potassium iodide, stir well, and allow to cool. After the solution has cooled, lay a piece of filter paper on a petri and brush the paste onto the filter paper. Turn the filter paper and brush the paste on the other side. Hang up and allow the filter paper to dry. Cut the papers into 1 inch-wide strips. Store the strips in a plastic bag out of sunlight.
2. The other half of the class will prepare Particulate matter collectors by smearing a thin layer of petroleum jelly onto a microscope slides. Try to make the layer as even as possible. Use a q-tip to lightly smear the specimen side of each slide. You will need to prepare 2 slides per group and place them in a slide container to avoid smearing the petroleum jelly on anyone.
3. Each group will place one labeled slide on the exterior of the school. Some groups should choose areas that would receive few particulates, others should choose locations that produce more particulates. (Keep in mind sources of particulate matter)
4. One member from each group should take the second slide and place it in a location inside the school.
5. You should then place your ozone monitoring strip outside for 8 hrs. Before placing the strip outside, dip the strip in distilled water, then attach the strip out of sunlight. When placing your strip find the relative humidity for that day.
6. The next day, each group should collect their slide and ozone monitoring strip.
7. Dunk each strip into distilled water. Use the chart at the right to determine the Schoenbein Number of your strip.
8. Use the relative humidity and the Schoenbein number to calculate the concentration of ground level ozone using the chart below.
9. Look at your particulate matter slide under the microscope. First decide the amount of particulates and then attempt to estimate the source of the PM. Your group will need to decide how you can classify what type of PM was collected.
10. Make sure you record all you lab information into your notebook.
Data:
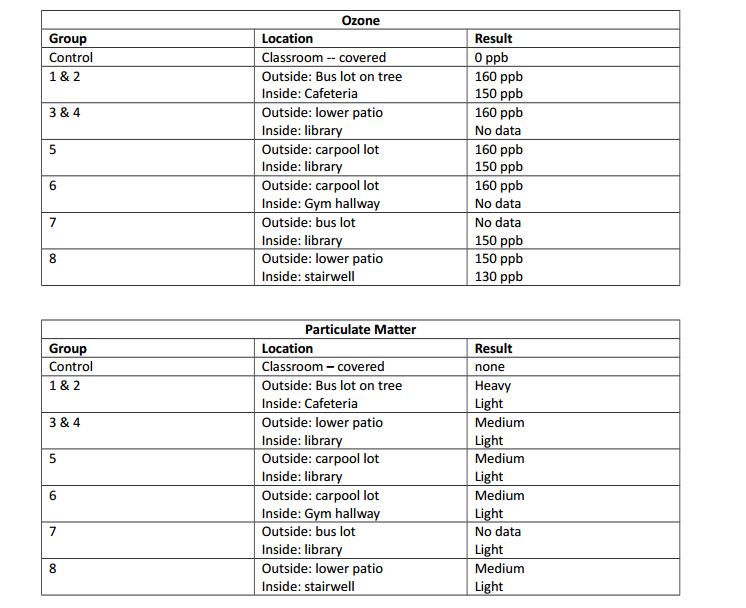
After placing one set in the library and one outside underneath a bush, we received the following results.
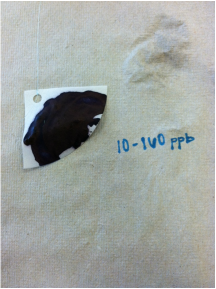
The first image of the ozone measurement was from outside. After looking at the Schoenbein Number chart we determined that it was a 10, because of its dark purple color. Using the Relative Humidity Schoenbein Number chart, it was also seen that with the humidity level being 50%, that the Ozone ppb was 160.
Our second ozone measuring device was taken out of the library.
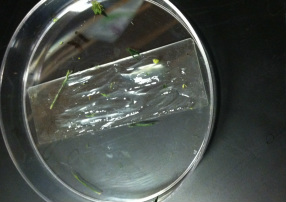
The second image is of the glass slide that was also placed outside underneath a bush. Even without looking under a microscope, you can see the particles of grass and other things on the slide. When we placed it underneath the microscope, we determined that the slide had a medium amount of particulate matter on it. We saw small bugs, and particles of dirt.
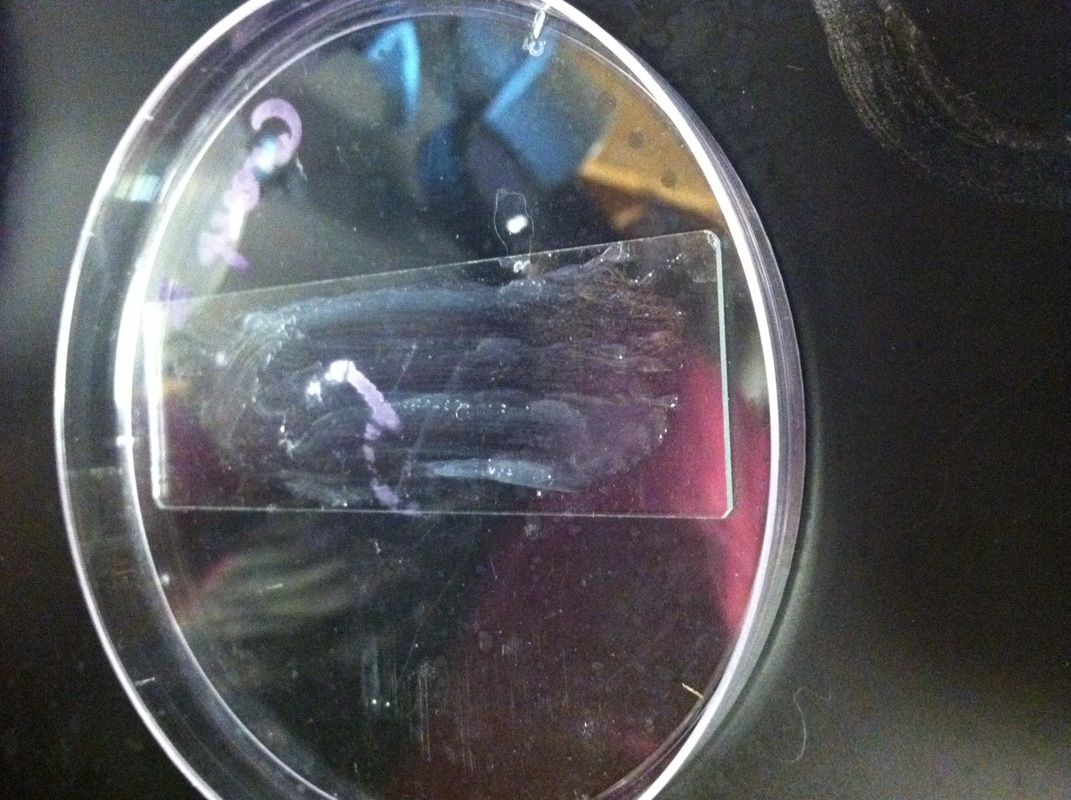
The third image is of the glass slide that was placed inside on a shelf in the library. You could not see very much on the slide without looking under the microscope. Once the slide was placed under the microscope, only a few particles of particulate matter were visible. It was determined that this slide had a light amount of PM on it.
Using items found in a science classroom setting, we were able to create two sets of tools that were able to help measure the levels of ozone inside and outside, and measure the amount of particulate matter inside, and outside, and compare the air quality of the two settings. Placing one set inside the school in the library, and one outside on the back patio, I made a hypothesis that the air quality inside the school would be better. Although the ozone measuring tool that was placed inside got misplaced, it was still concluded that the hypothesis was true using all of the classroom's data, the air quality inside of Heritage High School, was better than that outside.
Problem:
How does the indoor air quality of Heritage High School, compare to the outdoor air quality?
Hypothesis:
If we measure air quality both indoor and outdoor, then the indoor air quality will be better.
Parts of the Experiment:
The independent variable in this experiment was the location where the air quality was tested. The dependent variable was the air quality measured. The control group was the Petri dish that we left covered, and the ozone measuring device that was covered as well. Both remained at zero. The controlled variables in the experiment were that the class had all the same types of filter paper, iodide and starch mixture, glass slides, q tips, and petroleum jelly
Materials:
Potassium Iodide, corn starch, beakers, spatulas, a large graduated cylinder, test tube rack, filter paper, microscope slides, petroleum jelly, q-tips, microscopes.
Method:
1. Half the class should work on preparing the ozone monitoring test strips by placing 100ml of water in a 250 ml beaker, and adding 5g of cornstarch. Then heat and stir the mixture until it gels (when the mixture becomes thick and clear). Remove the solution from heat, add 1 g of potassium iodide, stir well, and allow to cool. After the solution has cooled, lay a piece of filter paper on a petri and brush the paste onto the filter paper. Turn the filter paper and brush the paste on the other side. Hang up and allow the filter paper to dry. Cut the papers into 1 inch-wide strips. Store the strips in a plastic bag out of sunlight.
2. The other half of the class will prepare Particulate matter collectors by smearing a thin layer of petroleum jelly onto a microscope slides. Try to make the layer as even as possible. Use a q-tip to lightly smear the specimen side of each slide. You will need to prepare 2 slides per group and place them in a slide container to avoid smearing the petroleum jelly on anyone.
3. Each group will place one labeled slide on the exterior of the school. Some groups should choose areas that would receive few particulates, others should choose locations that produce more particulates. (Keep in mind sources of particulate matter)
4. One member from each group should take the second slide and place it in a location inside the school.
5. You should then place your ozone monitoring strip outside for 8 hrs. Before placing the strip outside, dip the strip in distilled water, then attach the strip out of sunlight. When placing your strip find the relative humidity for that day.
6. The next day, each group should collect their slide and ozone monitoring strip.
7. Dunk each strip into distilled water. Use the chart at the right to determine the Schoenbein Number of your strip.
8. Use the relative humidity and the Schoenbein number to calculate the concentration of ground level ozone using the chart below.
9. Look at your particulate matter slide under the microscope. First decide the amount of particulates and then attempt to estimate the source of the PM. Your group will need to decide how you can classify what type of PM was collected.
10. Make sure you record all you lab information into your notebook.
Data:
After placing one set in the library and one outside underneath a bush, we received the following results.
The first image of the ozone measurement was from outside. After looking at the Schoenbein Number chart we determined that it was a 10, because of its dark purple color. Using the Relative Humidity Schoenbein Number chart, it was also seen that with the humidity level being 50%, that the Ozone ppb was 160.
Our second ozone measuring device was taken out of the library.
The second image is of the glass slide that was also placed outside underneath a bush. Even without looking under a microscope, you can see the particles of grass and other things on the slide. When we placed it underneath the microscope, we determined that the slide had a medium amount of particulate matter on it. We saw small bugs, and particles of dirt.
The third image is of the glass slide that was placed inside on a shelf in the library. You could not see very much on the slide without looking under the microscope. Once the slide was placed under the microscope, only a few particles of particulate matter were visible. It was determined that this slide had a light amount of PM on it.
|
|
|
Our class data table also showed that for the most part all of our data was very consistent.
Specific Conclusion Questions:
1. The highest rating the EPA will allow for a community for ground level ozone is 80 ppb. Any community with over 80 ppb for an average over three years is in noncompliance with the Clean Air Act. Compare your number to this standard. Did Wake Forest meet the standard on this day? Using what you know about the formation of ozone, decide if you believe the measurement you made was an accurate measurement of the air quality and why.
Our number on this day was double this allowed rating. It was 160 ppb. Wake Forest did not meet this standard on this day. I believe that this measure might not have been extremely accurate because it was a very simple form of technology that we used to measure the ozone and perhaps it was not accurate.
2. 13% of counties in the US are not meeting the Ozone requirements of the Clean Air Act. Use the chart below and information from class to explain the reason for the location of the counties in Non-attainment.
The location of all these counties that are not meeting their Ozone requirements are around major cities. This is most likely why the levels of ozone are higher in these areas.
3. Particulate matter has recently been added to the requirements of the Clean Air Act. Theorize reasons that it was not part of the act until the 1990’s.
Most likely because of the increase of industrial processing during the '90s. This greater amount of industry across the entire US would automatically increase the levels of PM in the air.
4. Compare and contrast the different PM samples – did they meet your expectations? Why or why not?
The PM samples did not meet my expectations. In my mind I expected the levels of PM to be higher inside than outside, just because of levels of PM in the library like dust. Now that I realized how much PM was actually located outside does make sense for those levels to be higher.
5. Explain why air quality monitoring is important for the health of the economy.
Air quality monitoring is important for the economies health because of industry. Industry is key to the success of the economy in America, and this means that with a greater amount of industry, a greater amount of environmental impact.
General Conclusion:
The air quality inside of Heritage High School ended up being better than the air quality outside. The inside PM level was much lower, and the ozone level was lower as well. This is most likely because of indoor air filtering, and that ground level ozone typically cannot occur inside because of lack of real sunlight. Lower levels of PM indoors are better for students that may have asthma or other respiratory problems. Buildings that may have higher levels of PM are more likely to cause sooner deaths because of their damages to the respiratory system. Possible errors for this lab was that some of the groups had no data for their final results which could have changed the consistency of the class data.
